
 Listen to this article
Quick Summary
|
✅ What Works |
⚠️ What Doesn’t |
|
Strong 1-month rebound (+15.14%) ahead of benchmark |
Trails benchmark across 3Y, 5Y, and since inception on an annualised basis |
|
Reasonable portfolio diversification — 38 stocks across sectors |
2.5% fixed fee is a heavy drag when net alpha is near zero or negative |
| Transparent communication and fund manager commentary |
Large-cap heavy mandate overlaps substantially with diversified MF portfolios |
| Established brand-based investment thesis with clear mandate |
Negative 2Y return (–0.76%) vs benchmark gain (+4.27%) — a meaningful gap |
Our Verdict: The Axis Brand Equity PMS has a coherent investment philosophy and a credible fund manager. But the data tells you something uncomfortable: across almost every meaningful time horizon, you would have done as well — or better — in a lower-cost alternative. That is worth sitting with.
Table of Contents:
- Who Should Read This
- Who This PMS May Still Suit
- Who Should Likely Avoid This PMS
- What Is the Axis Brand Equity PMS?
- Axis Brand Equity PMS Performance Review
- The Fee Reality: What You Are Actually Paying
- The Zero-Based Thinking Test
- Decision Factor Scorecard: All 12 Factors Assessed
- The Core Portfolio Architecture Question
- What a Genuinely Complementary PMS Looks Like
- Exit Considerations: What You Need to Know
- Key Takeaways
- Frequently Asked Questions
- Our Approach
Who Should Read This
- You currently hold the Axis Brand Equity PMS and haven’t reviewed your returns net of fees in the past year
- You are evaluating this PMS for the first time and want an independent, data-grounded perspective
- You want to understand whether a brand-focused large-cap PMS genuinely earns its fee premium
- You are an HNI investor who already holds diversified equity mutual funds and wants to know if this PMS adds anything new
- You are approaching your exit window and want to understand tax and load implications before making a move
Who This PMS May Still Suit
- Investors who want a professionally managed, actively traded equity portfolio with a single point of accountability — and are comfortable paying for that service
- Those who value concentrated brand-quality investing and have a long-term horizon (7+ years) to weather style cycles
- HNIs who do not hold significant large-cap or multi-cap mutual funds in their core portfolio — and therefore face less overlap risk
- Investors who genuinely appreciate quarterly commentary and direct fund manager communication as part of their investment experience
Who Should Likely Avoid This PMS
- Investors who already hold Nifty 50 index funds, large-cap, or flexi-cap mutual funds — the overlap with top holdings is likely higher than you realise
- Anyone expecting this strategy to generate consistent alpha across multiple market cycles — the data does not currently support that expectation
- Cost-conscious investors: at a 2.5% fixed fee, you are paying a significant premium over mutual funds and index funds for returns that have not yet justified that premium
- Investors with a 3–5-year horizon — the since-inception return of 8.27% per annum trails the benchmark’s 12.31%, compounding that gap meaningfully over shorter windows
What Is the Axis Brand Equity PMS?
The Axis Brand Equity Portfolio is a multi-cap, equity-oriented PMS strategy launched on 27 January 2017 by Axis Asset Management Company Limited.
It is managed by Mr. Hitesh Zaveri, SVP and Head — Listed Equity Alternatives, who brings over 25 years of experience across portfolio management, investment banking, and equity research.
The mandate is clear: invest in companies with established and emerging brands that offer sustainable competitive advantage, capable management, and good corporate governance.
The portfolio holds 34 stocks across financial services, capital goods, automobiles, healthcare, and consumer services.
|
Key Parameter |
Details |
| Strategy |
Axis Brand Equity Portfolio |
|
Inception Date |
27 January 2017 |
| Fund Manager |
Mr. Hitesh Zaveri (SVP & Head — Listed Equity Alternatives) |
|
AUM (Latest) |
₹704 Crores |
| Minimum Investment |
₹50 Lakhs |
|
Primary Benchmark |
NIFTY 50 TRI |
| Market Cap Allocation |
Multi-cap: Large 59.6% | Mid 29.6% | Small 6% |
|
Number of Stocks |
38 |
| Fixed Fee |
2.50% per annum |
|
Variable Fee Option |
1.50% + 20% profit sharing above 12% hurdle |
| Exit Load |
Year 1: 3% | Year 2: 2% | Year 3: 1% |
The promise of the mandate is directionally sound: brands often do command pricing power, customer loyalty, and durable competitive moats.
The honest question, however, is whether this thesis has translated into returns that justify the fee premium — and the data you are about to see will answer that question directly.
Axis Brand Equity PMS Performance Review
When did you last actually check whether this PMS is beating its benchmark — net of all fees? Here is the complete picture.
Trailing Returns (Latest Available Data)
|
Period |
Axis Brand Equity | NIFTY 50 TRI (Benchmark) | Alpha (+ / -) |
| 1 Month | 15.14% | 7.49% |
+7.65% |
|
3 Months |
2.08% | -5.15% | +7.23% |
| 6 Months | -5.41% | -6.53% |
+1.12% |
|
1 Year |
2.34% | -0.28% | +2.62% |
| 2 Year (p.a.) | -0.76% | 4.27% |
-5.03% |
|
3 Year (p.a.) |
9.85% | 11.20% | -1.35% |
| 5 Year (p.a.) | 9.85% | 11.69% |
-1.84% |
|
Since Inception (p.a.) |
9.85% | 13.07% |
-3.22% |
Returns are net of all fees and expenses. Returns over 1 year are annualised.
Calendar Year Performance
Benchmark returns are approximate for context based on index data.
Historical calendar year performance reveals an inconsistent pattern.
The strategy has outperformed in select years — most notably CY23 — but has broadly trailed or matched the benchmark across the majority of its operating history.
This is not a one-bad-year story.
Across nine calendar years, the strategy has delivered clear, consistent alpha in fewer than two.
The since-inception annualised gap of 4.04% against the Nifty 50 TRI — compounded over more than eight years — is not a rounding error.
It is a structural reality you deserve to examine.
To be fair: the brand-quality style has faced genuine headwinds from factor rotation, with markets at times favouring commodity cycles, PSU themes, and momentum over quality and brand.
These are legitimate context notes — but context does not pay your bills. What matters is whether the philosophy, when tested across a full market cycle, has delivered.
The Fee Reality: What You Are Actually Paying
If the index fund is doing more with less, what exactly are you paying 2.5% for?
The Axis Brand Equity PMS charges a fixed fee of 2.50% per annum under the fixed fee option, or 1.50% plus 20% profit sharing above a 12% hurdle under the variable fee structure.
All performance data from the fund is disclosed net of fees — which is the correct and honest way to report it. But it is worth translating that fee into rupee terms, because percentages can feel abstract.
Fee Drag on ₹50 Lakhs: The Rupee Picture
|
Scenario |
Gross Return Assumed | Corpus After 5 Years | Corpus After 7 Years |
|
Axis Brand Equity (net, 9.85% p.a.) |
~12.35% gross est. | ₹80.3 Lakhs | ₹97.2 Lakhs |
| Nifty 50 Index Fund (11.69% – 0.15% fee = ~11.54%) | 11.54% net | ₹86.5 Lakhs |
₹1.07 Crores |
| Gap (index fund advantage) | ₹6.2 Lakhs |
₹9.8 Lakhs |
These numbers are based on since-inception annualised returns for the PMS (8.27% net) versus the benchmark’s 5-year return (10.01%), with an index fund fee assumption of 0.15%.
The gap of nearly ₹10 lakhs over 7 years on a ₹50 lakh investment is not a theoretical exercise — it is the quietly compounding cost of underperformance combined with a higher fee structure.
That said, one important nuance: all PMS returns shown are already net of fees. The gross return of the strategy before fees may well be closer to 12–12.5%, which would indicate active stock picking does add some value.
The problem is not that the manager is doing nothing — it is that what is being added is being eroded by the cost of accessing it.
The Zero-Based Thinking Test
Here is the most important question in this entire article. Sit with it.
Knowing everything you know today — the actual net-of-fee returns, the benchmark gap, the fee structure, the performance pattern across calendar years — if you were starting completely fresh with this money tomorrow, would you put it into this same product?
Not “should I exit” (that is a different question, and we will get to it). This question is purely about the forward decision, stripped of history.
Most investors in underperforming products do not exit because of sunk cost bias. You have already paid the fees. You have already experienced the underperformance. You feel — rationally — that exiting now would be “locking in” the loss.
But here is the thing: that money is already gone. The fees left your account regardless of performance. The underperformance relative to the benchmark already happened.
The only decision that matters now is the forward one: what is the best use of this capital from today? And for that decision, past investment in this product is irrelevant. The sunk cost is not an argument for staying. It is an argument for nothing — because it is already sunk.
Exiting is not admitting failure. It is acting rationally with the information you now have. The investor who stays invested without re-examining the logic is not being loyal to their original thesis — they are being loyal to inertia. Those are not the same thing.
Ask yourself this: if a trusted advisor showed you today’s performance data on a product you had never heard of — same numbers, same fee, same benchmark gap — and asked if you wanted to invest ₹50 lakhs, what would you say?
That answer is your zero-based decision.
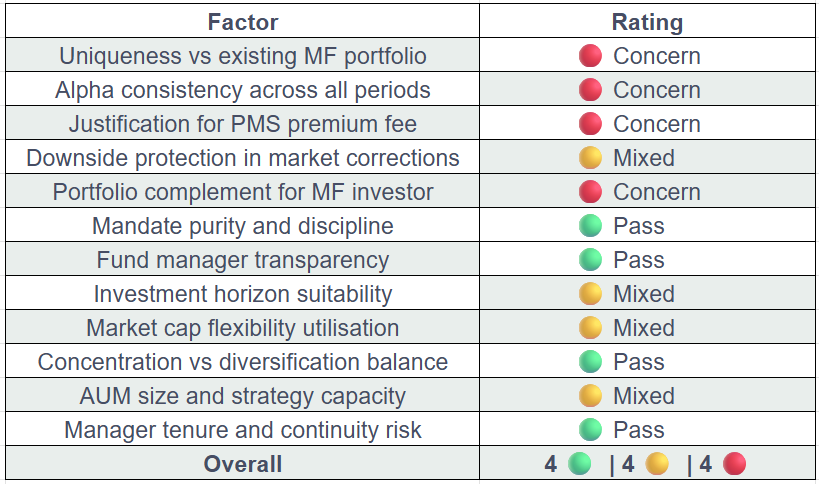
Decision Factor Scorecard: All 12 Factors Assessed
|
Decision Factor |
Rating | Analysis |
| Uniqueness vs existing MF portfolio | 🔴 |
With ~52% in large caps and top holdings including M&M, Granules India, Bharti Airtel, ICICI Bank, and Sagility India — stocks that feature in most diversified and flexi-cap mutual funds — the overlap risk is high. If you hold a flexi-cap or multi-cap mutual fund, you likely already own several of these names. The ‘brand’ lens does not make these holdings structurally different from what your MF manager already holds. |
|
Alpha consistency across all periods |
🔴 |
The data shows alpha is positive only over short recent periods (1M, 3M, 1Y). Across 2Y, 3Y, 5Y, and since inception on an annualised basis, the strategy trails its primary benchmark. The since-inception gap of -4.04% per annum is persistent, not episodic. Outperformance in CY23 remains the primary bright spot in an otherwise difficult record. |
|
Justification for PMS premium fee |
🔴 | A 2.5% fixed fee demands consistent net-of-fee outperformance over the benchmark and over lower-cost alternatives. The data does not support that justification across the periods tested. An index fund delivering ~9.86% net versus this strategy’s ~6.55% net creates a compounding gap that grows materially over 5–7 years. |
| Downside protection in market corrections | 🟡 |
In the most recent steep correction, the portfolio fell -10.71% versus the benchmark’s -11.3% — a marginal cushion. Over the broader 6-month drawdown period, the strategy delivered -15.09% versus the benchmark’s -9.02% — underperforming the benchmark materially over the half-year. This is a reversal from earlier resilience, and is a data point worth monitoring closely. |
|
Portfolio complement for MF investor |
🔴 |
A PMS earns its position in a satellite allocation by accessing what mutual funds structurally cannot — illiquid mid/small caps, concentrated special situations, or genuinely differentiated sector plays. A brand-focused, largely large-cap strategy does not meet this bar. You can get substantially similar exposure through a good flexi-cap or quality-factor mutual fund at a fraction of the cost. |
|
Mandate purity and discipline |
🟢 | The fund manager has remained broadly consistent with the brand-quality mandate. Monthly commentary shows active portfolio construction thinking — new additions (Ujjivan SFB, IDFC First Bank, TBO Tek) are explained with clear investment rationale. There is no evidence of aggressive style drift or momentum-chasing inconsistent with the stated mandate. |
| Fund manager transparency | 🟢 |
Mr. Hitesh Zaveri has been openly communicative through published fund manager briefs and monthly factsheets. Commentary is intellectually honest — acknowledging macro headwinds, providing sector-level attribution, and discussing market positioning without spin. This is a genuine positive and relatively uncommon in the PMS industry. |
|
Investment horizon suitability |
🟡 | The strategy recommends a 3-year minimum horizon. Across the 3-year trailing period, the strategy has returned 6.46% annualised — less than the benchmark’s 10.03%. The fund has been running for over 8 years, and the since-inception gap is widening, not closing. Long-term investors have not yet seen the patience thesis pay off relative to a passive alternative. |
| Market cap flexibility utilisation | 🟡 |
The strategy is classified as Multi-Cap, but with ~52% in large caps and ~4% in small caps, the current allocation skews conservative. Mid-caps have grown to 38%, up from earlier levels, indicating a shift in portfolio construction. The fund manager’s most recent commentary notes tactical positions in real estate and EMS — suggesting the flexibility is being used, but selectively. Whether this is disciplined caution or conservative drift is a fair question. |
|
Concentration vs diversification balance |
🟢 | At 34 stocks with top-5 holdings at 22.6% and top-10 39.6%, the portfolio is reasonably diversified — neither dangerously concentrated nor so broad as to be closet-indexing. This is a balanced construction for the strategy’s stated. |
| AUM size and strategy capacity | 🟡 |
At ₹704 crores (down from ₹1,400 crores reported earlier in the year), the AUM has declined materially — possibly reflecting redemptions or market-related factors. For a multi-cap strategy with large-cap orientation, the current AUM does not create liquidity constraints. However, the decline warrants a closer look at investor sentiment trends. |
|
Manager tenure and continuity risk |
🟢 |
Mr. Hitesh Zaveri joined the fund house in 2022 and has been managing this strategy since then. With over 25 years of experience across portfolio management, investment banking, and equity research — including prior roles at Aditya Birla MF, Enam Asset Management, and Edelweiss Capital — the manager brings deep institutional credibility. No recent team changes are indicated. |
Summary Scorecard
The Core Portfolio Architecture Question
Here is a framework that may help you think about this more clearly.
At Holistic Financial Services, we structure client portfolios around a core-satellite architecture. The core is built with low-cost, broadly diversified mutual funds — index funds, flexi-cap, multi-asset.
These do the heavy lifting: they give you market exposure at minimal cost, across thousands of companies, with deep liquidity and tax efficiency.
The satellite is where a PMS or AIF earns its place. But it earns that place by doing something the core cannot: accessing genuine return streams that are structurally unavailable in mutual funds. Concentrated mid-cap special situations. Sector-specific deep-value plays.
Uncorrelated strategies. Opportunities that mutual funds are too large, too regulated, or too diversified to access effectively.
The honest question for you is this: does the Axis Brand Equity PMS occupy the satellite slot in your portfolio because it genuinely adds something your core cannot — or because it was sold to you as a premium product and you assumed premium meant differentiated?
A brand-focused, predominantly large-cap strategy, benchmarked to the Nifty 50 TRI, is doing substantially what a good flexi-cap mutual fund does.
That is not a criticism of the philosophy. It is a structural observation about where this product fits — and does not fit — in a well-constructed portfolio.
What a Genuinely Complementary PMS Looks Like
Without naming any specific product or competitor, here is what a satellite-worthy PMS strategy typically looks like:
- It operates in market segments that mutual funds structurally cannot — genuine small and micro-cap concentration, sector-specific deep dives, or concentrated special situations with 15–25 stock portfolios
- It has a documented and demonstrable alpha track record, net of fees, across at least one full market cycle (typically 5+ years including a significant drawdown period)
- It does not replicate your existing core MF holdings at the stock level — the top 10 holdings should look meaningfully different from what you already own
- The fee structure is proportionate to the value created — typically in strategies where mutual funds cannot operate, the PMS format genuinely unlocks access that justifies the cost
- It has a clearly defined, testable, and bounded mandate — one that the fund manager demonstrably sticks to across market conditions
Exit Considerations: What You Need to Know
If you are considering exiting, here is the practical picture you need before making any decision.
Exit Load Schedule
- Year 1: 3% of the amount withdrawn
- Year 2: 2% of the amount withdrawn
- Year 3: 1% of the amount withdrawn
- After Year 3: No exit load
If you exit in year one, here is exactly what it costs you: on a ₹50 lakh corpus, that is ₹1.5 lakhs in exit load alone — before tax. That is a real cost, and it does change the calculus for recent entrants.
Tax Treatment
PMS portfolios are structured as individual stock portfolios in your name — not as pooled units like mutual funds. This means each stock sale within the PMS is taxed at the individual trade level. Stocks held over 12 months attract Long-Term Capital Gains (LTCG) tax at 12.5% (above the ₹1.25 lakh annual exemption). Stocks held under 12 months attract Short-Term Capital Gains (STCG) at 20%. The portfolio manager’s trading decisions within your PMS directly affect your tax liability in each financial year.
Staggered Exit Strategy
If the exit load period has passed or is near-complete, a staggered exit across 2–3 tranches can help manage STCG exposure by timing realisation of gains into a new financial year. A qualified advisor can map your specific holding period for each stock before you initiate any exit instruction.
Key Takeaways
- The Axis Brand Equity PMS has a coherent mandate and a credible, experienced fund manager. The investment philosophy — brands with sustainable competitive advantage — is intellectually sound.
- However, the performance data is clear: the strategy has underperformed its primary benchmark (Nifty 50 TRI) across 2Y, 3Y, 5Y, and since inception on an annualised net-of-fee basis.
- The since-inception gap of 4.04% per annum against the benchmark, compounding over 8+ years, translates into a material rupee disadvantage for long-term investors.
- At a 2.5% fixed annual fee, you need consistent gross outperformance well above the benchmark for the net return to justify the premium over a low-cost index fund. That hurdle has not been cleared.
- The large-cap heavy allocation (~60%) creates meaningful overlap with diversified mutual fund portfolios — the strategy does not occupy a genuinely differentiated satellite position for most HNI investors.
- The fund manager scores well on transparency and mandate discipline — these are real positives that should be acknowledged.
- Apply the zero-based thinking test before deciding to stay or exit: knowing everything you know today; would you invest in this product fresh? If the answer is no, that is your answer.
- Exits should account for the load schedule, per-stock tax treatment, and the current market timing. A staggered approach may reduce your effective tax and cost burden.
Frequently Asked Questions
Q1: Is the Axis Brand Equity PMS a good investment?
The strategy has a coherent philosophy and an experienced fund manager. However, based on current data, it has not generated consistent net-of-fee alpha over the benchmark across most time horizons. Whether it is right for you depends on your existing portfolio, investment horizon, and appetite for the fee structure.
Q2: What are the Axis Brand Equity PMS returns?
Trailing returns as of the most recent period: 1 month -10.71%, 1 year -7.7%, 3 years 6.46% p.a., 5 years 6.55% p.a., since inception (Jan 2017) 8.27% p.a. The primary benchmark (Nifty 50 TRI) has returned 12.31% p.a. since inception over the same period.
Q3: What fees does the Axis Brand Equity PMS charge?
Two fee options are available: (1) Fixed fee of 2.50% per annum, or (2) Variable fee of 1.50% per annum plus 20% profit sharing above a 12% hurdle rate. Exit loads apply in Years 1–3 (3%, 2%, 1% respectively).
Q4: Is PMS better than mutual funds in India?
Not automatically. A PMS earns its place when it accesses genuinely differentiated opportunities that mutual funds structurally cannot — concentrated mid/small cap plays, special situations, or sector strategies. A large-cap or brand-focused PMS competes directly with diversified mutual funds and index funds at a significantly higher cost.
Q5: How do I exit the Axis Brand Equity PMS?
Investors can request exit by contacting their relationship manager or the PMS service team directly. Note that exit loads apply in Years 1, 2, and 3. Each stock in your portfolio is taxed individually at realisation — LTCG at 12.5% for holdings over 12 months, STCG at 20% for shorter-term holdings.
Q6: What is Hitesh Zaveri’s investment philosophy?
Mr. Zaveri focuses on companies with strong brands, sustainable competitive advantage, capable management, and good corporate governance. He emphasises fundamental research — annual reports, conference call transcripts, and industry analysis — combined with macro awareness. He has publicly stated his preference for businesses with limited competitive intensity and manageable capital cyclicality.
Q7: Does PMS portfolio overlap with mutual funds?
This is one of the most important questions to ask before investing in any PMS. For the Axis Brand Equity strategy, with approximately 60% in large caps and top holdings including names like ICICI Bank, M&M, and Zomato, there is meaningful overlap potential with most diversified equity mutual fund portfolios. Check your MF top-10 holdings against the PMS top-10 holdings carefully.
Q8: What is the minimum investment for Axis Brand Equity PMS?
The minimum investment is ₹50 lakhs. Systematic Transfer Options (STO) are available in 5 or 10 instalments.
Q9: How does PMS performance compare to index funds in India?
Across the Axis Brand Equity PMS’s operating history, the Nifty 50 TRI (the strategy’s own primary benchmark) has outperformed the PMS on a since-inception annualised basis by approximately 4.04% per year. A Nifty 50 index fund tracking the same index at ~0.15% fee would have delivered substantially similar benchmark returns at a fraction of the cost.
Q10: What should I check before staying invested in a PMS?
Apply the zero-based thinking test: knowing everything today, would you invest fresh? Also verify: net-of-fee returns versus the benchmark across multiple periods; overlap with your existing mutual fund holdings; whether the mandate is genuinely differentiated; and whether the fee is proportionate to value delivered, not just to the narrative.
Our Approach
At Holistic Financial Services, we evaluate PMS strategies across the market with one clear filter: does this strategy genuinely complement your existing portfolio, or does it simply replicate what your mutual funds already do?
We only recommend a PMS where it adds something structurally distinct — accessing market segments, styles, or opportunities that your core mutual fund holdings cannot.
If a PMS overlaps meaningfully with what you already own, it does not belong in your portfolio, regardless of how compelling the narrative sounds.
If you would like us to assess whether your current PMS is truly earning its place — or to identify one that does — we offer a complimentary portfolio review consultation.
Just a conversation grounded in data, and a clear second opinion on whether every rupee is working as hard as it should.

Leave a Comment