


Category: PMS Review | Multi Cap & Flexi Cap Benchmark: S&P BSE 500 TRI | Inception: June 2018 | AUM: ₹1,099 Cr
Quick Summary
|
What Works |
What Doesn’t |
|---|---|
|
Experienced fund management team |
Benchmark underperformance across 1, 2, 3 and 5-year periods |
|
Catalyst-driven mandate — differentiated on paper |
High fee drag erodes already modest gross returns |
|
Strong communication and transparency |
Top holdings overlap heavily with standard MF portfolios |
|
Disciplined mandate adherence |
Limited downside protection in recent corrections |
Our Verdict: For investors already holding diversified mutual funds, the ABSL India Special Opportunities Portfolio does not currently clear the bar for fee-justified, complementary PMS allocation. The data — across multiple time horizons — does not support the premium. A portfolio review is worth doing before staying the course.
Table of Contents:
- Who Should Read This
- Who This PMS May Still Suit
- Who Should Likely Avoid This PMS
- What Is the ABSL India Special Opportunities Portfolio?
- Performance Review: The Numbers in Full
- The Fee Reality: What Reaches Your Account
- The Zero-Based Thinking Test
- Decision Factor Scorecard
- The Core Portfolio Architecture Question
- What a Genuinely Complementary PMS Looks Like
- Exit Considerations: Practical Guidance
- Key Takeaways
- Frequently Asked Questions
- Our Approach
Who Should Read This
- Investors currently invested in the ABSL India Special Opportunities PMS evaluating whether to stay or exit
- HNI investors considering this PMS as a new allocation
- Investors asking whether their PMS is genuinely adding value over their mutual fund portfolio
- Anyone researching “Aditya Birla PMS review” or “ABSL India Special Opportunities performance”
Who This PMS May Still Suit
Before the detailed review, fairness demands this upfront: this strategy may still be appropriate for a small subset of investors:
- Investors with no existing large-cap or diversified MF exposure, for whom the portfolio would not represent an overlap
- Investors with a genuine 7–10 year horizon and high tolerance for style-cycle underperformance
- Investors who entered before 2020 and carry significant embedded gains that make exit tax-inefficient
- Investors seeking brand trust and AMC credibility over pure alpha, and who accept benchmark-level returns for that comfort
For everyone else — particularly the typical HNI investor with 3–5 existing SIPs in diversified funds — the analysis below raises serious questions worth examining honestly.
Who Should Likely Avoid This PMS
- Investors already holding large-cap, flexi-cap, or multi-cap mutual funds (high portfolio overlap)
- Investors expecting meaningful alpha net of 2.5% fees over their benchmark
- Investors with less than a 7-year horizon
- Investors seeking a genuine satellite complement to their existing MF core
What Is the ABSL India Special Opportunities Portfolio?
The India Special Opportunities Portfolio is a PMS strategy from Aditya Birla Sun Life AMC, one of India’s largest and most credible asset management companies. It was incepted in June 2018 and is benchmarked against the S&P BSE 500 TRI.
Key Facts at a Glance:
|
Parameter |
Detail |
|---|---|
|
Category |
Multi Cap & Flexi Cap PMS |
|
Benchmark |
S&P BSE 500 TRI |
|
Inception |
14 June 2018 |
|
Minimum Investment |
₹50,00,000 |
|
AUM |
₹1,099 Crore |
|
Number of Stocks |
24 |
|
Top 5 Stocks Concentration |
24.28% |
|
Top 5 Sectors Concentration |
63.46% |
|
Portfolio Age |
~7 years 9 months |
Fund Managers:
- Sameer Narayan — Head, Alternate Investments (Equity), 27+ years in Indian equity markets. Previously Head – PMS at Invesco Asset Management India.
- Salvin Shah — Fund Manager, 13+ years in portfolio management and equity research.
Investment Approach: The strategy focuses on 15–25 companies positioned to benefit from specific catalysts — Micro Turnarounds, Business Cycle Changes, Management Change, Deleveraging, Demerger events, and Mid-to-Large Cap migration potential.
On paper, this is a genuinely differentiated mandate. Event-driven, catalyst-oriented strategies can, in the right hands, generate returns uncorrelated with standard market beta. The question is whether that differentiation shows up in the actual portfolio — and in the returns.
Performance Review: The Numbers in Full
Returns as of 31st March 2026. Source: PMS Bazaar / ABSLAMC public disclosures. Calculated using TWRR methodology.
Trailing Returns
|
Period |
India Special Opps Portfolio |
S&P BSE 500 TRI |
Alpha |
|---|---|---|---|
|
1 Month |
-10.66% |
-11.37% |
+0.71% |
|
3 Months |
-13.91% |
-13.94% |
+0.03% |
|
6 Months |
-10.27% |
-9.62% |
-0.65% |
|
1 Year |
-9.66% |
-3.12% |
-6.54% |
|
2 Year |
-1.80% |
+1.32% |
-3.12% |
|
3 Year |
+10.71% |
+12.89% |
-2.18% |
|
5 Year |
+11.47% |
+11.76% |
-0.29% |
|
Since Inception |
+12.88% |
+11.79% |
+1.09% |
Calendar Year Performance
|
Year |
Portfolio Return |
|---|---|
|
CY19 |
+12.45% |
|
CY20 |
+19.26% |
|
CY21 |
+36.45% |
|
CY22 |
+5.70% |
|
CY23 |
+33.02% |
|
CY24 |
+17.15% |
|
CY25 |
+0.31% |
|
CY26 YTD |
-14.33% |
What the data shows: The portfolio has generated positive alpha only in two windows — certain bull market years, and over the full since-inception period. Across every meaningful recent horizon (1, 2, 3, and 5 years), the strategy has underperformed its benchmark. The 1-year underperformance of 654 basis points is particularly notable.
A fair contextual note: The post-2022 period has been challenging for many quality and GARP-oriented strategies. A significant rotation toward cyclicals, PSU banks, infrastructure, and defence played out between 2021 and 2024 — sectors the CCP-style mandate was not positioned to capture. This context is relevant. Style cycles are real, and temporary underperformance does not automatically signal a broken strategy.
However, when underperformance persists across multiple rolling periods — 1-year, 2-year, 3-year, and 5-year — despite a full market cycle, the concern shifts from temporary style headwind to a more structural question about fee-adjusted value delivery. That is the question this review addresses.
The Fee Reality: What Reaches Your Account
The portfolio charges:
- Fixed Fee: 2.50% per annum on AUM
- Variable Fee: 1.00% fixed + 20% profit sharing above 12% hurdle
- Exit Load: 2% (Year 1), 1% (Year 2), Nil (Year 3+)
Fee-Adjusted 5-Year Comparison
|
Gross CAGR |
Fee |
Net CAGR |
|
|---|---|---|---|
|
ABSL Special Opps PMS |
11.47% |
2.50% |
~8.97% |
|
S&P BSE 500 TRI (benchmark) |
11.76% |
— |
11.76% |
|
Nifty 500 Index Fund |
~11.60% |
~0.15% |
~11.45% |
|
Category median flexi-cap MF |
~14–15% |
~0.9% |
~13–14% |
On ₹50 lakhs over 5 years:
- ABSL Special Opps PMS (net ~8.97%): approximately ₹76.7 lakhs
- Nifty 500 Index Fund (net ~11.45%): approximately ₹86.1 lakhs
The fee drag alone represents approximately ₹9.4 lakhs over 5 years — and that is before accounting for the gross underperformance of the portfolio relative to the benchmark.
The index fund comparison is not meant to suggest that passive investing is always superior to active management. It is meant to establish the minimum bar: an active PMS at 2.5% fees must generate sufficient gross alpha to justify that fee over a passive alternative. Over 5 years, the data shows it has not.
The Zero-Based Thinking Test
This is the most useful mental framework for any investor reviewing a long-held allocation.
“Knowing everything I know today — about the actual returns, the fees, the benchmark comparison, and the alternatives available — if I were starting fresh with this money, would I choose this same product?”
The power of this question is that it cuts through:
- Sunk cost bias — “I’ve already been here 4 years, may as well wait”
- Inertia — staying not because the product is right but because changing requires a decision
- Loss aversion framing — booking an exit feels like “locking in a mistake”
None of these psychological forces are good investment logic. The capital you have invested today is not a historical artefact — it is a live resource with an opportunity cost ticking every year.
If your honest answer to the zero-based question is “probably not,” the rational follow-up is not panic. It is a structured three-step process:
- Confirm your exit load status — Year 3+ investors face zero financial exit penalty
- Map what your capital could be doing instead — a genuine portfolio-level gap analysis
- Execute with clarity, not emotion
The discomfort of acknowledging a suboptimal allocation is temporary. The cost of remaining in one is compounding.
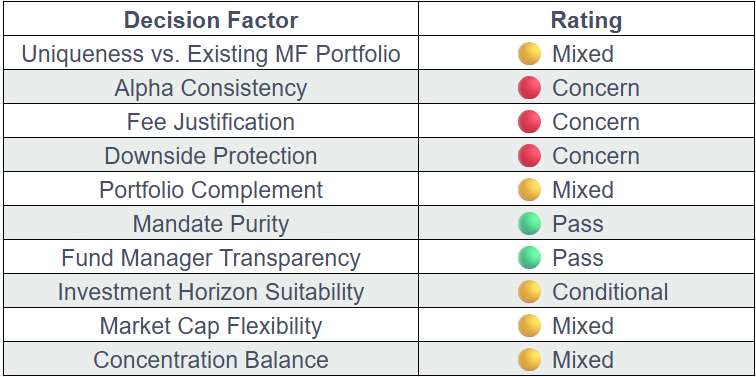
Decision Factor Scorecard
We evaluate every PMS against a consistent set of decision factors before recommending it. Here is the honest assessment for the ABSL India Special Opportunities Portfolio.
1. Uniqueness vs. Existing MF Portfolio 🟡 MIXED
The catalyst-driven mandate — turnarounds, demergers, deleveraging — is theoretically more differentiated than a standard quality or growth strategy. This is a genuine positive.
In practice, however, the portfolio’s top holdings include ICICI Bank, Axis Bank, Bank of Baroda, and Bharat Dynamics. The first three names appear in virtually every diversified mutual fund an HNI investor typically holds. For an investor with existing large-cap, flexi-cap, or multi-cap fund exposure, the actual stock-level overlap is likely significant.
The mandate differentiates. The portfolio, as currently constructed, partially undermines that differentiation.
2. Alpha Consistency Across All Periods 🔴 CONCERN
Consistent alpha across varied market cycles is the core justification for PMS fees. The ABSL India Special Opportunities Portfolio has underperformed its benchmark across every major recent time horizon: 1-year (-6.54%), 2-year (-3.12%), 3-year (-2.18%), and 5-year (-0.29%).
A temporary period of underperformance attributable to style-cycle headwinds is a legitimate explanation. But when underperformance persists across multiple rolling periods through a full market cycle, the question must be asked: is the fee justified by the alpha that is actually being delivered?
Based on the available return data, the evidence does not currently support a yes.
3. Justification for PMS Premium Fee 🔴 CONCERN
At 2.5% per annum on ₹50 lakhs, the annual fee is ₹1.25 lakhs — regardless of performance. Over a 7-year period, that is approximately ₹8.75 lakhs in cumulative fees, before accounting for the compounding drag those fees impose on the portfolio.
For that premium to be justified, the strategy must deliver measurable value that cheaper alternatives cannot: consistent net-of-fee alpha, access to genuinely differentiated opportunities, or meaningful downside protection. The return data across recent periods does not demonstrate this on a fee-adjusted basis.
4. Downside Protection in Market Corrections 🔴 CONCERN
Active management’s most defensible value proposition is capital protection during downturns — the ability to reduce exposure, shift to defensives, or simply avoid the worst-hit areas of the market.
The 1-year return of -9.66% versus the benchmark’s -3.12% during a market correction period is a direct challenge to this thesis. The portfolio amplified losses relative to the index at exactly the moment when active management was supposed to provide an advantage. The 6-month comparison (-10.27% vs -9.62%) continues the same pattern.
5. Portfolio Complement for an MF Investor 🟡 MIXED
A satellite PMS allocation earns its place by doing what a core MF portfolio cannot: accessing smaller, less-covered companies; capturing special situation alpha; providing genuine strategic diversification.
The ABSL India Special Opportunities Portfolio’s catalyst-driven mandate is genuinely positioned to deliver this in theory. In practice, the degree to which large, heavily-covered names like ICICI Bank and Axis Bank dominate current holdings reduces the differentiation effect for a typical MF investor.
For an investor whose MF portfolio has limited banking or PSU exposure, the overlap concern is lower. For most diversified MF investors, it remains a real consideration.
6. Mandate Purity and Discipline 🟢 PASS
The team maintains clear philosophical consistency — the catalyst-driven framework is evident in communications, quarterly letters, and portfolio positioning. This discipline is commendable and above average for the industry.
The concern is not mandate drift. The concern is whether the mandate, executed as described, generates sufficient alpha to justify the fee structure in the current market environment.
7. Fund Manager Transparency 🟢 PASS
Sameer Narayan is a credible professional with a strong industry track record. The team communicates openly through PMS Bazaar interviews, quarterly updates, and fund manager briefs. Transparency in communication is genuine and above industry average.
8. Investment Horizon Suitability 🟡 CONDITIONAL
With an inception date of June 2018, the strategy has now been tested across approximately 7 years and 9 months — covering a full market cycle including the COVID crash, the recovery bull run, and two subsequent correction phases.
The since-inception alpha of +1.09% is positive in gross terms. Net of 2.5% annual fees, however, the since-inception net return trails the benchmark’s gross return — meaning a passive index fund investor has done better over the same period.
For investors who entered at or near inception and have a strong long-term view, the calculus is different from investors who entered in 2021–2022. Both groups deserve an honest, individualised assessment.
9. Market Cap Flexibility Utilisation 🟡 MIXED
The multi-cap and flexi-cap mandate gives the managers genuine flexibility to move across market capitalisations. This is a structural advantage the PMS format offers over many mutual fund categories. Whether this flexibility is being fully and skilfully deployed — particularly during rotation cycles — is a key question for investors to ask directly in their next portfolio review call.
10. Concentration vs. Diversification Balance 🟡 MIXED
24 stocks with 63.46% in the top 5 sectors represents moderate concentration — enough to amplify specific bets but not concentrated enough to generate the outsized alpha that genuine conviction-based portfolios can deliver. This middle ground can sometimes offer the costs of concentration without its full benefits.
Summary Scorecard
The Core Portfolio Architecture Question
The most important frame for evaluating any PMS is not “is this a good product in isolation?” It is: “Does this make my overall portfolio better — and does it earn its fee by doing so?”
Most HNI investors are already heavily exposed to large-cap India through:
- Nifty 50 / Sensex index funds and ETFs
- Balanced advantage and hybrid funds (typically 50–70% large cap)
- Flexi-cap and multi-cap mutual funds
- Direct equity holdings in blue-chip names
A well-designed investment architecture separates the core (broad, low-cost, diversified MF exposure) from the satellite (selective PMS/AIF strategies that genuinely complement the core by accessing what mutual funds structurally cannot).
The satellite’s job is to zig when the core zags — providing genuine diversification of strategy, market cap exposure, and return drivers. A satellite PMS that overlaps substantially with the core portfolio does not add strategic value, regardless of its standalone merit.
The question for ABSL India Special Opportunities investors is whether this allocation is genuinely filling a gap in their overall portfolio — or whether it is adding a premium-fee layer of exposure they already have.
What a Genuinely Complementary PMS Looks Like
For context, here is what we look for when selecting a satellite PMS for a client:
- Verifiable alpha across at least two full market cycles — not just bull markets
- Low stock-level overlap with the client’s existing MF holdings (we map this at the individual security level)
- Market cap differentiation — ideally accessing mid, small, or micro-cap opportunities that large-cap MFs cannot efficiently hold
- Mandate clarity — a clearly defined, consistently executed strategy with a genuine information or process edge
- Fee justification — a track record where net-of-fee returns meaningfully exceed what a comparable passive or active MF alternative delivers
The right PMS for a given investor depends entirely on what they already own and what genuine gaps exist in their current allocation. There is no universal answer — only a portfolio-specific one.
Exit Considerations: Practical Guidance
If you are currently invested and considering an exit, here is what to evaluate:
Exit Load:
- Year 1: 2.00% — factor carefully into exit cost
- Year 2: 1.00% — may still be worth acting depending on opportunity cost
- Year 3+: Nil — no financial penalty to exit
Tax: PMS taxation occurs at the individual stock level (unlike mutual funds). Each stock sold triggers capital gains tax — 20% + cess for short-term holdings (under 12 months), 12.5% + cess on gains above ₹1.25 lakh for long-term holdings. A staggered exit across financial years may optimise your tax position. Request a tax lot analysis from your relationship manager before instructing redemption.
A note on timing: If specific holdings are within weeks of completing 12 months, brief patience on those lots may save meaningful tax. However, tax optimisation should not become an indefinite reason to defer a rational portfolio decision.
Key Takeaways
- The ABSL India Special Opportunities Portfolio has underperformed its benchmark (S&P BSE 500 TRI) across 1-year, 2-year, 3-year, and 5-year trailing periods as of March 2026.
- After the 2.5% annual fee, the net returns over 5 years trail not just the benchmark but also what a simple Nifty 500 index fund would have delivered.
- The catalyst-driven mandate is theoretically differentiated. In practice, current holdings include large, widely-covered banking names that most HNI investors already hold through their mutual funds.
- The strategy is managed by experienced professionals with strong communication standards. Underperformance in recent periods is partly explained by style-cycle headwinds — but when that explanation persists across multiple rolling periods, investors deserve to ask harder questions.
- For investors in Year 3 and beyond, there is no exit load barrier. The decision to stay or redirect capital should be made on forward-looking portfolio logic, not on sunk-cost reasoning.
- The zero-based thinking test is the right starting point: “Would I invest here fresh today, knowing what I know?” If the honest answer is no, a structured portfolio review is the rational next step.
Frequently Asked Questions
Q1: Is the Aditya Birla Sun Life AMC India Special Opportunities Portfolio a good PMS?
The strategy has a credible team and a differentiated mandate on paper. However, fee-adjusted returns across recent periods do not clearly justify the 2.5% fee for investors who already hold diversified mutual funds with overlapping large-cap exposure.
Q2: What is the minimum investment for ABSL India Special Opportunities PMS?
₹50,00,000 (₹50 lakhs), as per SEBI’s mandated minimum for all PMS products.
Q3: What is the ABSL Special Opportunities PMS benchmark?
S&P BSE 500 TRI — India’s broad 500-company index.
Q4: What are the fees for ABSL India Special Opportunities PMS?
2.50% per annum (fixed fee model), or 1.00% fixed + 20% profit sharing above a 12% hurdle (variable model). Exit load: 2% in Year 1, 1% in Year 2, nil from Year 3.
Q5: Has the ABSL Special Opportunities PMS beaten its benchmark?
Only on a since-inception basis (gross). Across 1-year, 2-year, 3-year, and 5-year trailing periods as of March 2026, the portfolio has underperformed the S&P BSE 500 TRI benchmark.
Q6: Is PMS better than mutual funds for large-cap investing?
Generally, no. For large-cap or broadly diversified strategies, low-cost index funds and quality active mutual funds consistently match or outperform PMS alternatives on a net-of-fee basis. The PMS structure adds genuine value when accessing truly differentiated opportunities — mid/small cap concentration, special situations, sector specialists — that mutual funds cannot efficiently replicate.
Q7: How do I exit ABSL India Special Opportunities PMS?
Submit a redemption instruction to ABSLAMC. Year 3+ investors face no exit load. Request a tax lot breakdown before executing to optimise capital gains tax treatment.
Our Approach
At Holistic Financial Services, we work with investors to build portfolios with a clear architecture: a low-cost mutual fund core providing broad market exposure, and a carefully selected PMS/AIF satellite that genuinely complements it — not duplicates it.
Before recommending any satellite PMS, we map it against a client’s full existing portfolio at the stock level, test it across our decision factor framework, and verify that the fee is justified by real, net-of-fee outperformance across market cycles.
If you are currently in the ABSL India Special Opportunities PMS and would like an independent, data-driven assessment of whether it is genuinely working within your overall portfolio, we offer a complimentary portfolio review.


Leave a Reply